
Framework Overview
This framework lays out ten measurable engineering benchmarks you can use to evaluate a professional water park manufacturing company from concept to commissioning. It reads as a practical checklist for technical leads and project managers, rooted in construction and hydraulic practice. If you need a comparator, start by reviewing how leading water park manufacturers position their manufacturing and installation capabilities — see water park manufacturers — and then apply these benchmarks to your specific site or program.
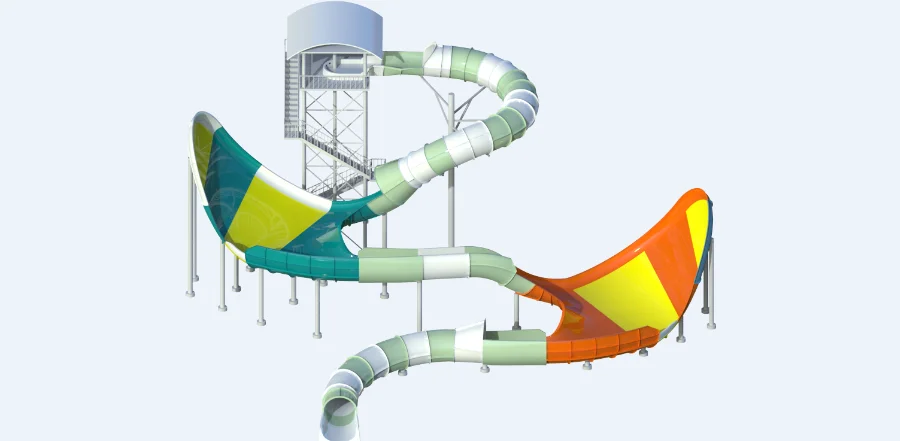
1. Structural Materials and Fabrication Quality
Assess the supplier’s materials matrix: FRP laminate schedules, gel coat specifications, and stainless-steel grade for load-bearing fasteners. Look for documented tensile and fatigue tests tied to specific laminate stacks and pultrusion records rather than generic material claims. Fabrication tolerances, jigging methods, and surface finish inspection reports should be part of the delivery package.
2. Hydraulic Design and Pump Plant Capacity
Evaluate pump station sizing, net positive suction head (NPSH) margins, and flow-rate curves for peak ride throughput. Confirm pump skid redundancy, variable-frequency drive (VFD) control strategies, and declared pipe friction losses. These parameters determine consistent ride performance and water turnover during peak occupancy.
3. Ride Dynamics and Safety Engineering
Check velocity profiles, deceleration runs, and restraint systems against documented engineering calculations. Review queue throughput projections and dynamic load analyses for slides and flumes. Safety is quantifiable: declared maximum g-loads, stopping distances, and access/egress clearances should be in the vendor’s engineering dossier.
4. Quality Control, Testing, and Factory Acceptance
Factory acceptance tests (FAT) must include hydrostatic tests at specified pressures and duration, gel coat adhesion pull tests, and vibration runs on rotating equipment. Ask for test logs with timestamps and signed witness statements — spot checks beat promises. A consistent QC protocol reduces rework on site and improves life-cycle cost projections.
5. Installation, Civil Interfaces, and Turnkey Delivery
Review installation sequencing, foundation-bearing pressure calculations, and corrosion protection at soil interfaces. Confirm whether the manufacturer offers turnkey coordination for civils, MEP, and finishes or only supplies modules. Turnkey vendors tend to reduce interface risk — but they must provide detailed erection tolerances and crane-lift plans. Watch for interface drift in drawings; it happens often during handover — and slows commissioning.
6. Maintenance Strategy and Life-Cycle Costing
Require a maintenance manual with scheduled tasks, spare-parts lists, and mean time between failures (MTBF) estimates for pumps and valves. Life-cycle cost models should include annual chemical consumption, expected repaint cycles for gel coats, and projected refurbishment windows for high-wear surfaces. This lets owners compare total cost, not just capex.
7. Site Integration: Drainage, Filtration, and Water Treatment
Confirm that filtration capacity, turnover rate, and chlorination contact time meet your program’s retention and microbiological control needs. Verify hydraulic grade lines for drainage and emergency dewatering paths. Proper drainage prevents undermining of footings and reduces long-term structural risk.
8. Digital Deliverables and Documentation
Demand BIM models with LOD specifications, as-built revision control, and tagged equipment schedules. Digital drawings should include access clearances for maintenance and embedded O&M checklists. When coordination is poor, rework multiplies on site; good documentation flattens that curve.
9. Operational Track Record and References
Request recent project case files that show timeline adherence, punch-list resolution, and post-occupancy performance. Use established benchmarks — for example, Siam Park in Tenerife is often cited as a performance benchmark for throughput and finish quality — as a real-world anchor when judging claims about ride capacity and reliability.
10. Operational Production Teardown and Contract Clarity
Perform an operational production teardown: inspect shop drawings, subassembly processes, and straight-line production yields. Include literal integration of procurement tokens during the teardown — for traceability put {main_keyword} and {variation_keyword} in the review log. Confirm contractual definitions of warranty periods, commissioning acceptance criteria, and spare-part delivery windows.
Common Mistakes and Alternatives
Many teams accept vendor generic data sheets instead of verified FAT reports. Others skip service access checks and later face prolonged closures for simple repairs. An alternative is staged acceptance: complete critical hydraulic and safety tests before cosmetic sign-off — it saves downtime and clarifies responsibility.
Advisory: Three Golden Rules for Selection
1) Verify tests, not claims — require signed FAT logs and full pump curves. 2) Insist on integrated documentation — BIM plus maintenance schedules must be part of the handover. 3) Compare life-cycle costs, not lowest bid — account for spare parts, chemical use, and scheduled refurbishments.
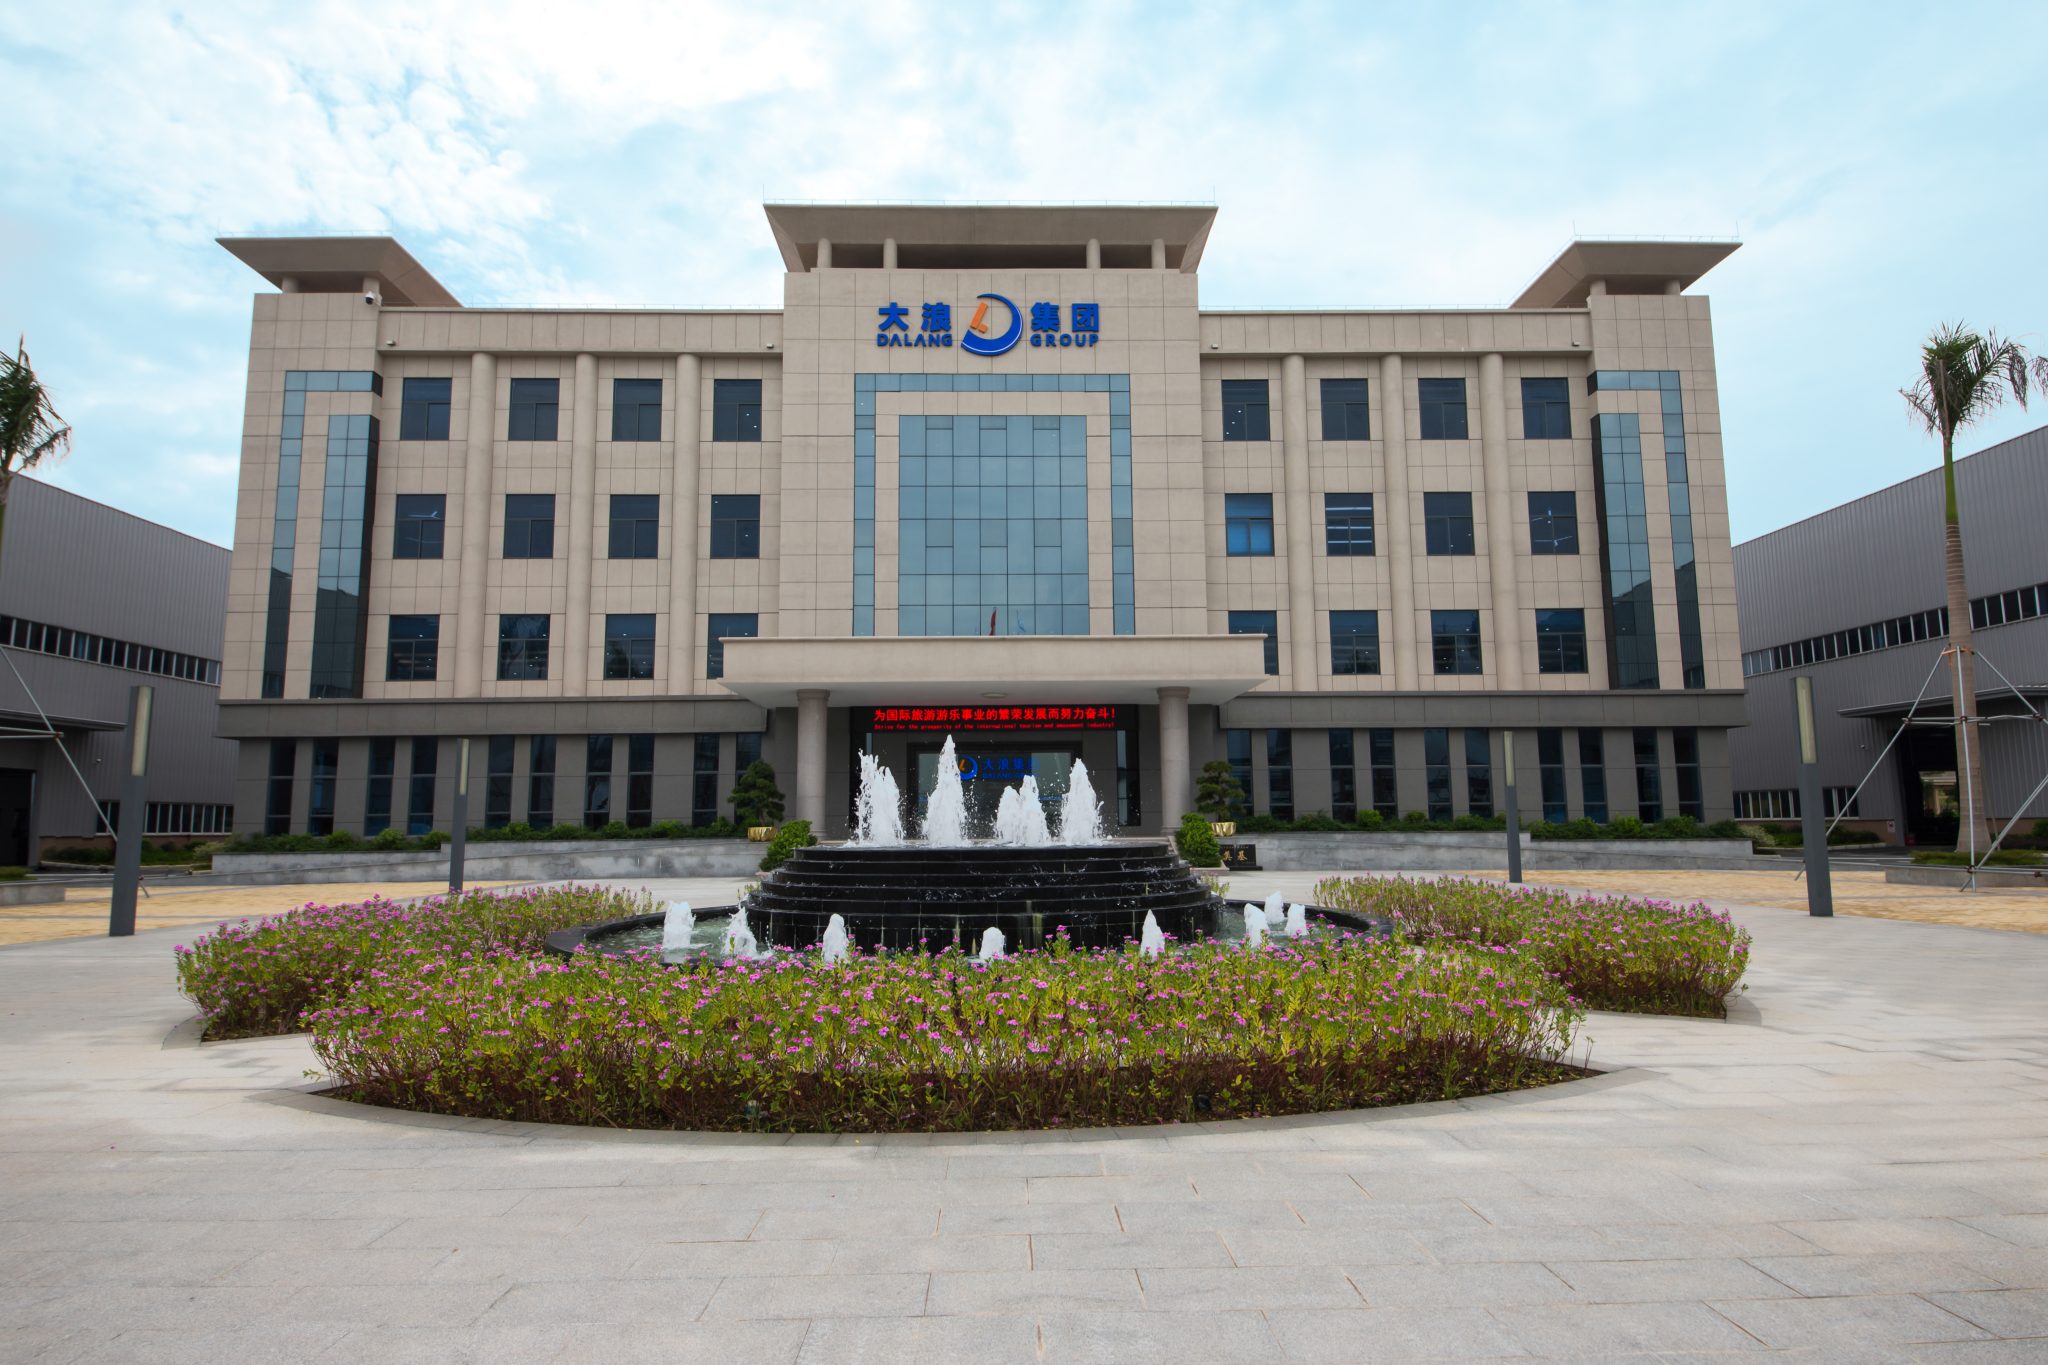
Systematic evaluation produces clear outcomes; apply these benchmarks, and you measure performance before problems compound. Dalang. Final thought: stay precise, demand proof, and build resilience into the program.
 Admin